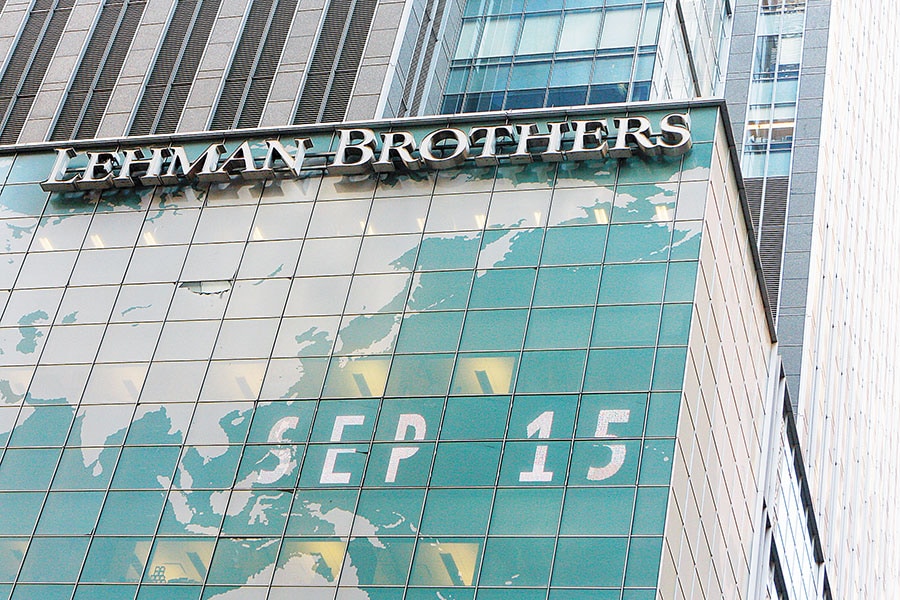
The world after Lehman Brothers
In the decade since the investment bank sank, what lessons have been learnt?
 The US government had rescued other enterprises before and after Lehman Brothers, but, for some reason, it let this Wall Street firm sink
Image: Joshua Lott / Reuters
Lehman Brothers, the fourth largest investment bank on Wall Street, filed for bankruptcy in the southern district court of New York at 1.45 am on Monday, September 15, 2008.
In April that year, while speaking at a conference, hedge fund manager David Einhorn had said investment banks were dangerous because half the money they made was used to give high salaries and bonuses to employees. And employees had strong reasons to increase the leverage of their trades, in the hope of making more money, and thus getting higher bonuses. The average bonus in the securities industry in New York (more popularly referred to as Wall Street) had gone up from around $60,900 in 2002 to $191,360 in 2006. In 2007, it fell to $177,830.
These high bonuses, Einhorn said, were risky. He substantiated his argument with the example of Lehman Brothers. If calculated properly, the firm had had a leverage of 44:1. This meant, for every dollar of its own money, the firm had borrowed $44 to spruce up the returns on its trades. Hence, even a 1 percent fall in the value of its investments would have wiped out half of its equity, and pushed the leverage to almost 80 times. “Suddenly, 44 times leverage becomes 80 times leverage and confidence is lost,” Einhorn said.
It is this high leverage that ultimately led to the company’s collapse. The American government had rescued Fannie Mae and Freddie Mac, two government-sponsored enterprises, just over a week earlier. A day later, it would bail out AIG, the world’s largest insurance company. But, for some reason, it let Lehman Brothers sink. Henry Paulson, the then American treasury secretary, had come in for a lot of criticism for rescuing Fannie and Freddie. “I’m being called Mr Bailout; I can’t do it again,” he had reportedly said.
Mr Bailout did rescue AIG and several other American financial firms (both normal and investment banks), after letting Lehman Brothers go. All over the world, central banks and governments came to the rescue of many financial firms on the verge of bankruptcy. These firms had piled on loads of debt, and in the process had excessive leverage (ie, they did not have enough of their own capital against the money they had borrowed).
It has been close to a decade since Lehman went down. The question is, has the world changed since then?

Let’s start with the total global debt across various sectors (see table above). The total global debt has gone up between 2007-end and 2017-end. While looking at the absolute level of debt is important, it is also important to account for the fact that the overall size of the global economy has grown in this decade.
World Bank data shows that the size of the global economy (ie, its gross domestic product or GDP) in 2007 was $57.8 trillion; by 2017, this had jumped to $80.7 trillion. Now, how does the table above look once we adjust for the increase in the size of the global economy?
The table below, which lists the global debt to GDP ratio, shows that financial sector debt has fallen over the last 10 years, from 93 percent of the global GDP to 73 percent, while debt of non-financial corporates has risen from 74 percent to 87 percent. In the aftermath of Lehman Brothers going bust, Western central banks printed money to drive down interest rates. The idea was that companies would borrow and expand, and people would borrow and spend. Companies did borrow, but primarily to buy back their shares and drive up their earnings per share. This benefitted the companies’ top management who had employee stock options.

Governments across the world have tried to revive their economies by borrowing and spending more. Between 2008 and 2017, the global economic growth averaged 2.41 percent per year, while it averaged 3.41 percent per year between 1999 and 2008.
At the end of 2007, total global debt was at 289 percent of global GDP; it has since risen to 295 percent. This makes the world a much more dangerous place now than it was in 2007.
Interestingly, according to The Banker, an international financial affairs publication, the top 1,000 banks in 2008 had a tier I capital-to-assets ratio of 4.44 percent. This has improved constantly over the decade, to 6.66 percent in 2018. Clearly, the banks now have more capital against their assets and hence, lesser leverage. Some lessons have been learnt from the mistakes made a decade ago.
Having said that, the average bonuses in the securities industry in New York in 2017, stood at $184,220, crossing the average bonus of 2007 for the first time. The interesting thing is that between 2016 and 2017, the global debt of the financial sector went up from $53 trillion to $59 trillion.
Does it mean that the Wall Street firms are leveraging big time again? Your guess is as good as mine.
Source: https://www.osc.state.ny.us/press/releases/mar18/wall-st-bonuses-2018-sec-industry-bonus-pool.pdf
Richard Swedberg, The Structure of Confidence and the Collapse of Lehman Brothers
David Wessel, In Fed We Trust: Ben Bernanke’s War on the Great Panic
(This story appears in the 30 November, -0001 issue of Forbes India. To visit our Archives, click here.)


