How air pollution across America reflects racist policies from the 1930s
After the Great Depression, Black and immigrant areas were typically outlined in red on maps to denote risky places to lend; these red-lined neighborhoods tend to have higher levels of harmful air pollution
 Racist policies in the past have contributed to inequalities across the United States today. Image AFP
Urban neighborhoods that were redlined by federal officials in the 1930s tended to have higher levels of harmful air pollution eight decades later, a new study has found, adding to a body of evidence that reveals how racist policies in the past have contributed to inequalities across the United States today.
After the Great Depression, when the federal government graded neighborhoods in hundreds of cities for real estate investment, Black and immigrant areas were typically outlined in red on maps to denote risky places to lend. Racial discrimination in housing was outlawed in 1968. But the redlining maps entrenched discriminatory practices whose effects reverberate nearly a century later.
To this day, historically redlined neighborhoods are more likely to have high populations of Black, Latino and Asian residents than areas that were favorably assessed at the time.
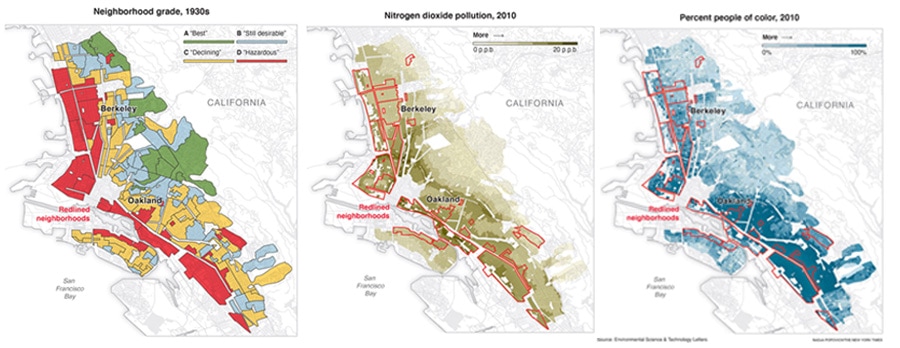
California’s East Bay is a clear example.
The neighborhoods within Berkeley and Oakland that were redlined are on lower-lying land, closer to industry and bisected by major highways. People in those areas experience levels of nitrogen dioxide that are twice as high as in the areas that federal surveyors in the 1930s designated as “best,” or most favored for investment, according to the new pollution study.
©2019 New York Times News Service


