The LIC draft prospectus for IPO screams, 'all is not well'

Forbes India has analysed the 652-page offer document filed by India's largest insurer to present quick takeaways on what the numbers say
Pooja Sarkar
Published: Feb 14, 2022 02:51:51 PM IST
Updated: Feb 14, 2022 03:23:59 PM IST

LIC has filed its draft red herring prospectus (DRHP) for its initial public offering (IPO) on February 13

Image: Ashish Vaishnav/SOPA Images/LightRocket via Getty Images​

India’s largest insurer and the fifth largest insurer globally, the Life Insurance Corporation of India (LIC) filed its draft red herring prospectus (DRHP) for its initial public offering (IPO) on February 13. The government of India, which is the sole owner of the insurance company, holds 632 crore shares in LIC and plans to offload five percent stake or 31.6 crore shares.

Forbes India breaks down quick takeaways from the 652-page offer document:

How big is LIC?

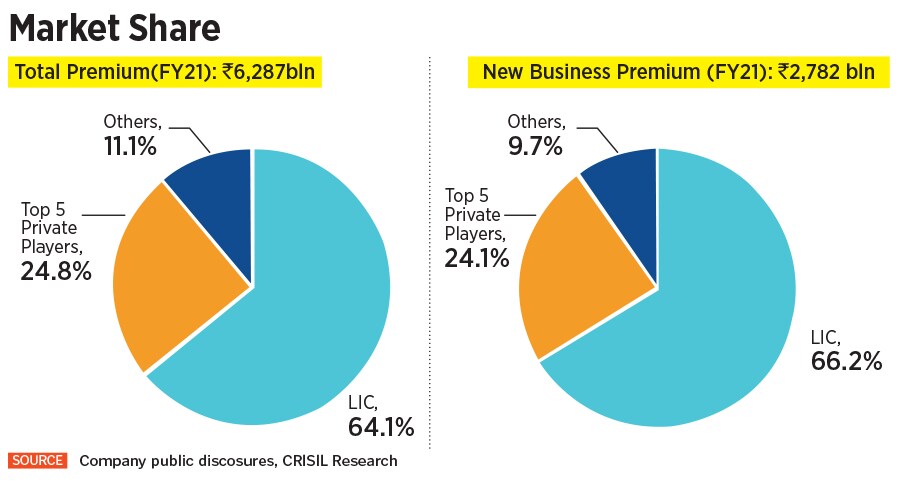
LIC has been providing life insurance service in India for more than 65 years. While there are 24 life insurance companies in India, LIC commands the largest market share.  The size of the Indian life insurance industry was Rs6.2 lakh crore on a total premium basis in fiscal 2021, up from Rs5.7 lakh crore in FY20. LIC’s gross written premium share is 64.1 percent as on FY2021.
Read More

What’s wrong with LIC’s new policies?

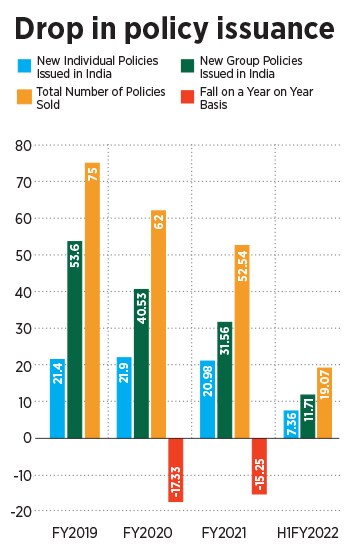
When it comes to new individual and group insurance policies, LIC has seen a drop in sales of its new policies. While in its DRHP, it says the Covid-19 pandemic has affected its business as most of the individual policies are sold through agents, one cannot ignore the fact that it has been selling lesser policies since the start of April 2018. For example, during April 2018-March 2019, way before the pandemic, it sold 75 million new policies, which fell to 62 million during April 2019-March 2020, a drop of 17.33 percent. On that drop, LIC further lost ground in FY2021 during the pandemic and sold 52.54 million policies, another drop of 15.25 percent on a year-on-year basis.

What has been the real impact of the pandemic on LIC?

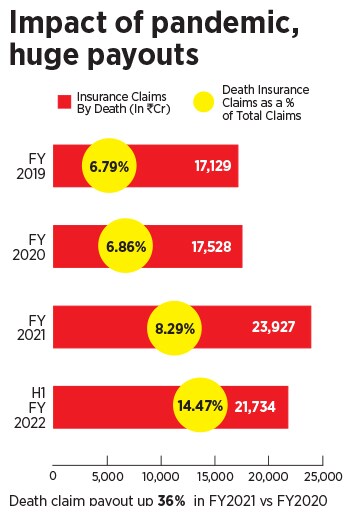
As the Covid-19 pandemic claimed more lives, families were dependent on the life insurance provider for payouts. During April 2020-March 2021, LIC paid Rs23,927 crore as part of insurance claims by death, which is 36 percent higher than what it paid in FY2020, which was Rs17,528 crore. But the impact of the second Covid-19 wave can be seen on its numbers from April-September 2021, when death claims skyrocketed to Rs21,734 crore for just the six months.

LIC is yet to report full year numbers, which means it has already paid nearly the same amount in half a year than what it did for the full of last year. Before the pandemic, death claims was around 6.8 percent of LIC’s entire payout of the portfolio, right now it is nearly 14.47 percent of its portfolio for just the half year, and it will be higher when full numbers are reported during the end of the year. For fiscal 2021 and the six months ended September 30, 2021, a separate mortality reserve of Rs23,45 crore and Rs7,420 crore, respectively, was provided for the Covid-19 pandemic on a consolidated basis.

What does persistency ratio really mean and why falling persistency is tied to the solvency ratio of LIC?
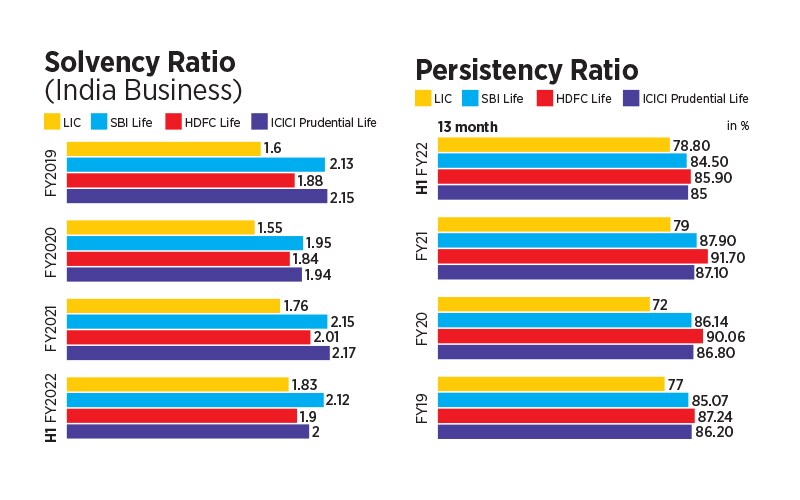
Persistency ratio means the amount of money (premium) that an insurance company is yet to get from policy holders on their existing policy, and the ratio is measured in terms of the number of policies and premiums underwritten. When compared to its peers, LIC’s persistency numbers have been falling. What this means is, there are people who are not paying the premiums for the insurance they have bought.

“Yes, the persistency ratio of LIC did fall. It could possibly be because of people’s incomes being negatively impacted during the aftermath of the Covid-19 and a general economic slowdown before that. With incomes being stretched or going toward Covid-related health expenses, not surprisingly, people went slowly on the payment of premiums. It is again a reflection of how different sections of society have been differently impacted economically due to Covid,” says Vivek Kaul, an economic commentator and author.

On the other hand, solvency ratio means if the company has enough capital to cover its short-term and long-term commitments, in case all of its policy holders choose to withdraw, does LIC have the money to pay them all? The insurance regulator in India mandates minimum solvency ratio of 1.50, but LIC’s solvency ratio for FY2021 was 1.76 percent and in FY2020 it was 1.55 percent. When compared to its peers in India, it has lowest solvency metric. Thus, the firm is facing pressure in terms of getting people to pay for their policies and is hoping to come up with new strategies to make them pay.

What is LIC’s claim settlement ratio

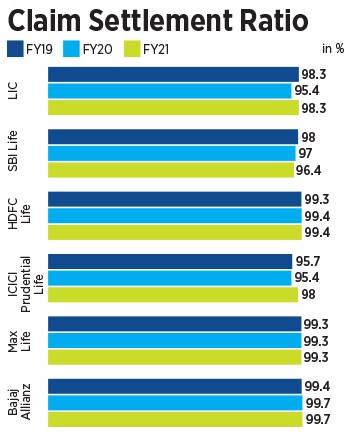
If you have an LIC insurance policy, then you might want to ask yourself, how much LIC does really pay when it comes to final settlements. One look at comparable figures with its peers of last three financial years, shows that it has one of the lowest settlement ratio. In FY21, it settled 98.3 percent of its claims, whereas, HDFC Life, Max Life and Bajaj Allianz were above 99 percent. In FY20, LIC’s settlement claim ratio was down at 95.4 percent.

What is LIC’s embedded value? And does the number justify itself?

Insurance companies use embedded value (EV) as a metric to estimate the consolidate value of the shareholder’s interest in a life insurance firm. It is usually calculated by adding the present value of future profits of a firm to the net asset value (NAV) of the firm's capital and surplus.

Now, Milliman, the firm that has done the valuation for LIC’s EV, has put India EV of LIC for March 2021 at Rs95,605 crore, and as on September 2021 at Rs 5,39,686 crore. The logical question to ask is how can a firm’s value go up by six times in six months, when most components have remained the same? Milliman assumed the present value of future profits as on March 31, 2021 at Rs1,04,772 crore and for September ending 2021 at Rs5,46,992 crore.

It seems bankers will have to provide a lot of explanation to shareholders on why the value has been ascribed. One of the reasons this question will keep getting raised is because LIC’s competitor HDFC Life was also valued by Milliman, and it had ascribed 21 percent year-on-year growth projection, which is close to the pricing models generally used.

One of the most important metrics for checking an insurance company’s performance is the value of new business or VNB margin, which indicates the profit margin of the firm. For example, for FY2021, HDFC Life’s new business margin stood at 26.1 percent and for H1FY22 it stands at 26.4 percent. Its VNB margin in its DRHP was reported at 22.02 percent, but for LIC, as on September 30,2021, its VNB stood at 9.3 percent, which means LIC is running its business on a low operating margin. Low operating margin, plagued with persistency issues and lower new sales of policies, can be challenging for LIC in the long run.​

“Indian embedded value increased from ₹956,050 million as at March 31, 2021 to ₹5,396,860 million as at September 30, 2021 mainly due to an increase in value of in-force business (VIF) from ₹892,450 million as at March 31, 2021 to ₹5,314,830 million as at September 30, 2021.  It was due to the increase in present value of future profits (which is the present value of projected distributable profits to shareholders arising from the in-force covered business), which was mainly on account of the segregation of the Life Fund, “ says Jayesh Bhanushali, AVP-research at IIFL Securities.

He adds, “Due to the segregation, it has resulted in the shareholders’ share of the surplus in the non-participating fund and the projected value of surplus from the non-participating global reserves increasing from the assumed allocation of 10 percent previously to 100 percent from September 30, 2021 onwards.”

X